ECSE 1010 Proof of Concepts - Alpha Lab03
0. Lab Document
1. Prove the Result of Summing 3 Sinusoidal Waves in the Time and Frequency Domains
Description
We are going to sum 3 basic type of sine wave and check its spectrum of frequency domain. See if that matches our expectation.
Analysis
To determine the time domain signal and frequency spectrum of summing 3 sinusoidal waves. We can use the properties of sinusoidal waves in time and frequency domains.
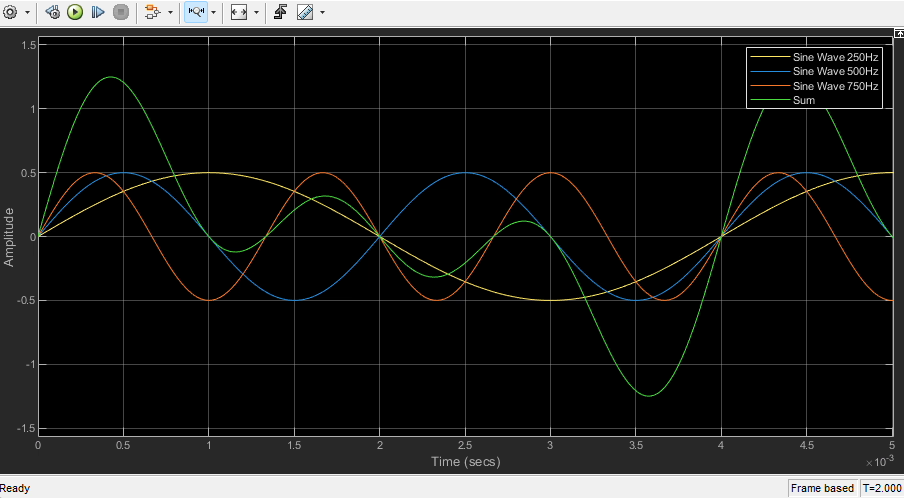
For example, Sine Wave , and should have a result of time domain like
For the frequency domain, it should be like
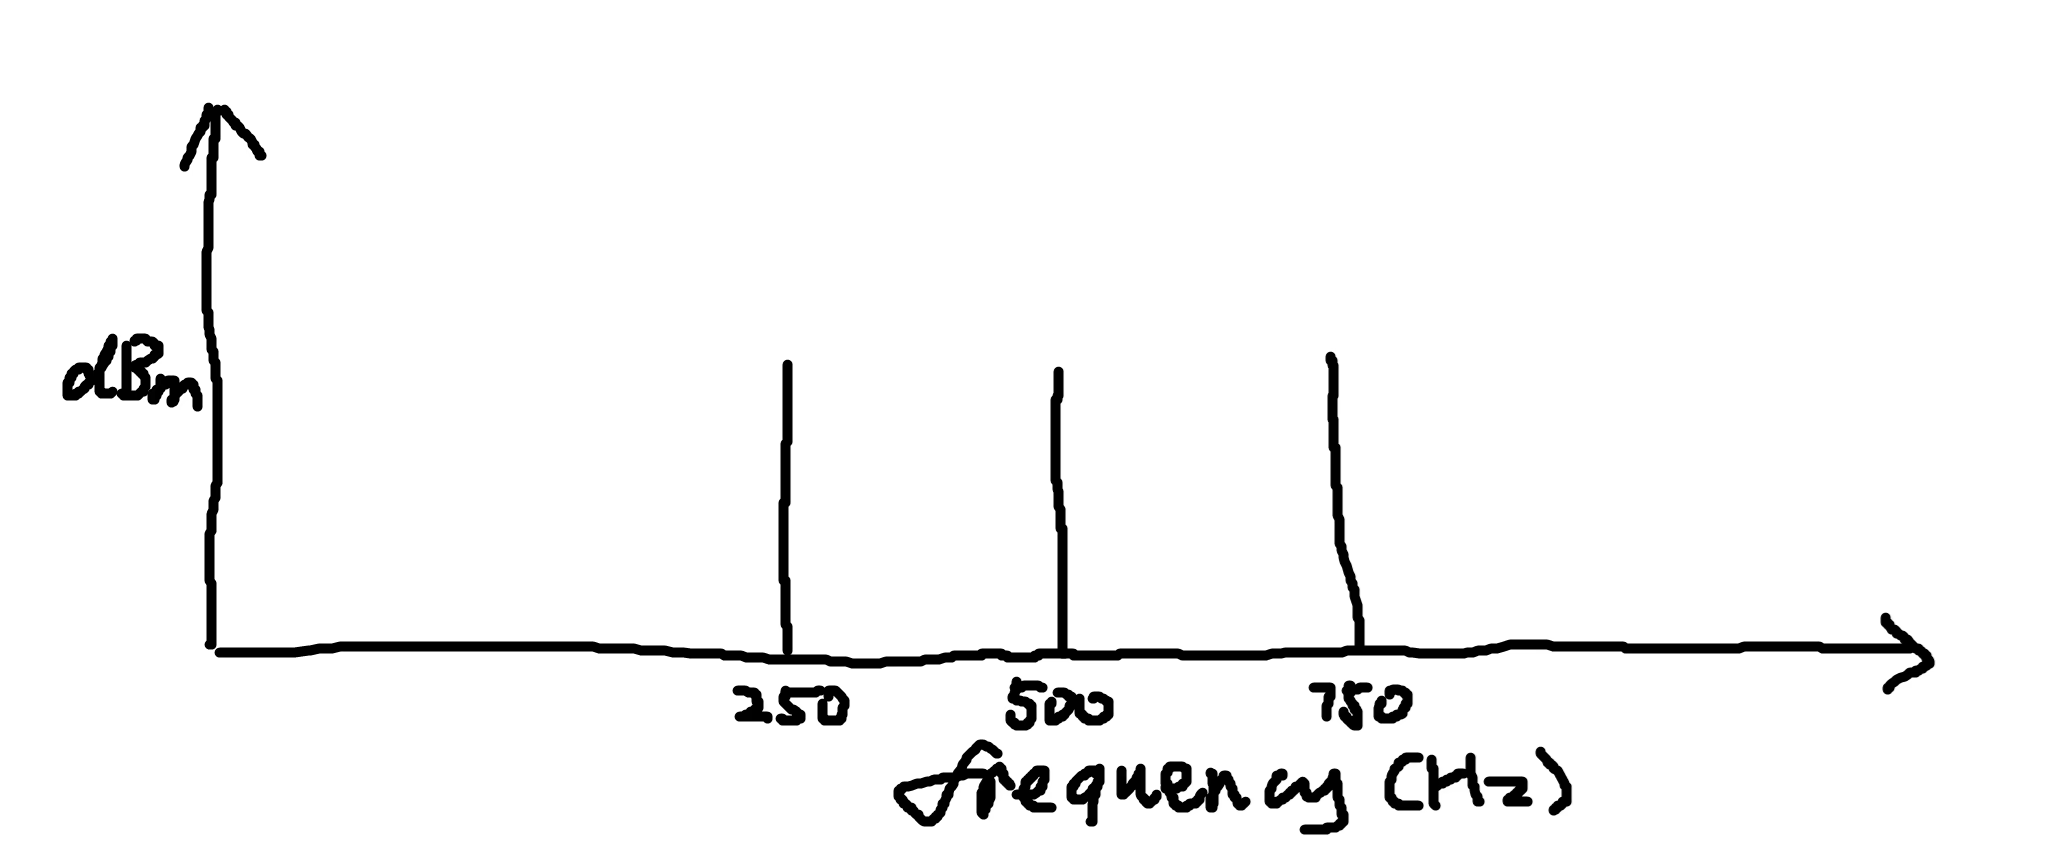
Since the sum is made by 3 single sine wave.
Simulation
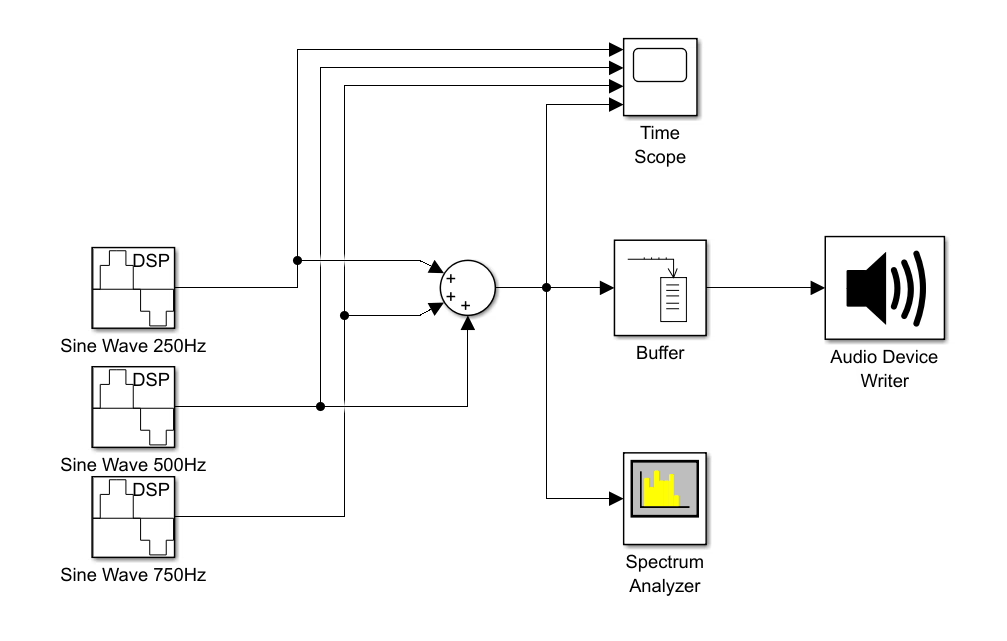

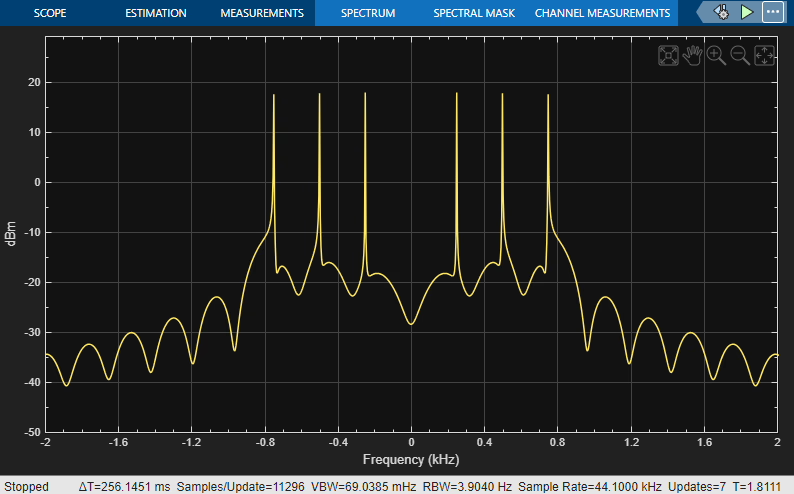
Discussion
Both our sketch and the simulation of frequency domain has 3 positive identical peaks. Which proves our analysis. The reason that they are not fully matched is due to Discrete Fourier Transform.
The sine wave used in this simulation is discrete sine wave. Unlike normal Fourier Transform, how many data point leads to how many frequency it went through. But the value in is extremely low. So, it makes no different.
2. Prove the Concept of Fourier Analysis by Determining Which Two Basic Types of Signals were Summed to Create This Mystery Signal
Description
We are going to find out two basic types of signals of a summed up signal by Fourier Analysis. To do that we are going to use the peak finder in spectrum analyzer in MATLAB.
Analysis
We can pick the most strong signal in frequency spectrum. That should be the two basic types of signals were summed to create this mystery signal.
Simulation
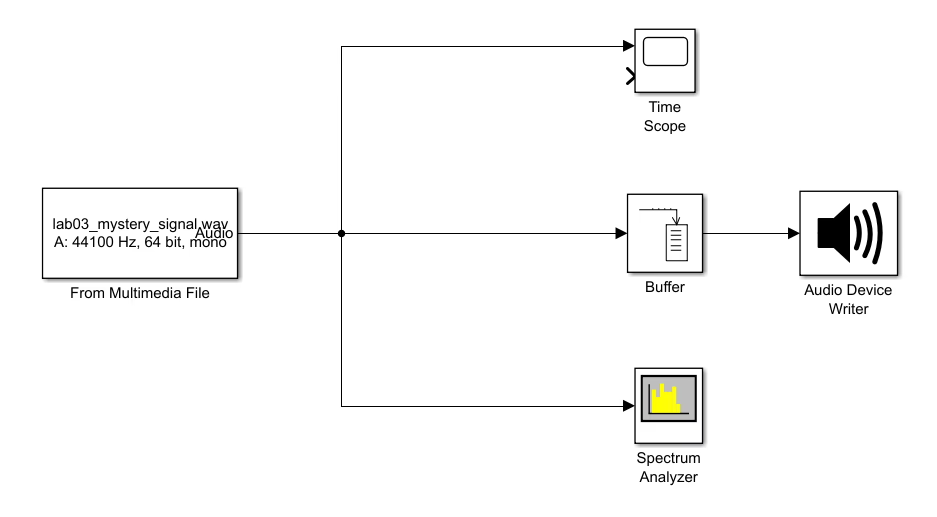
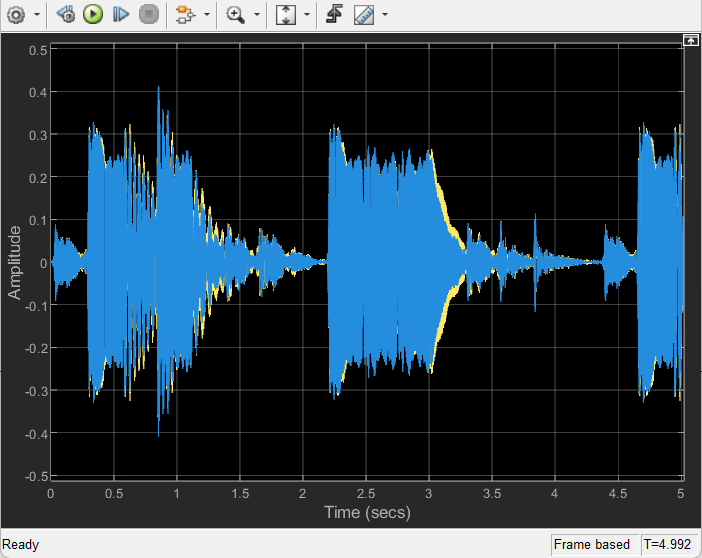
Let’s load Mystery Signal Audio File
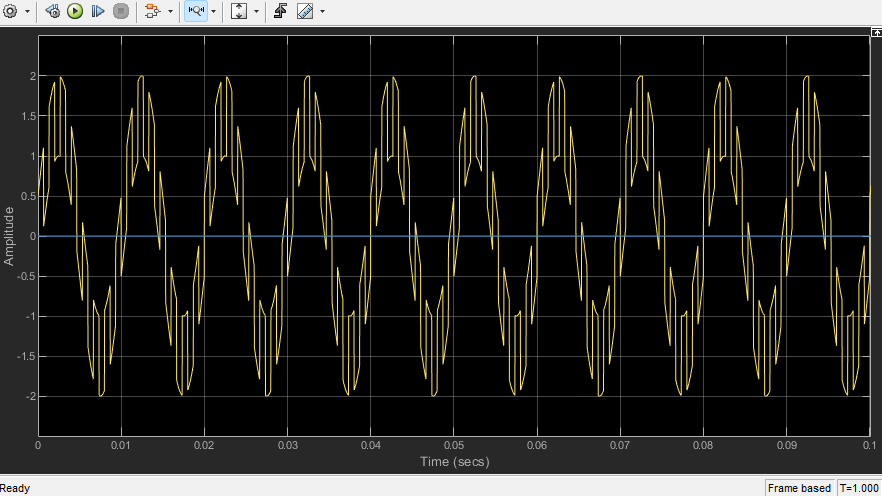
The time domain looks like
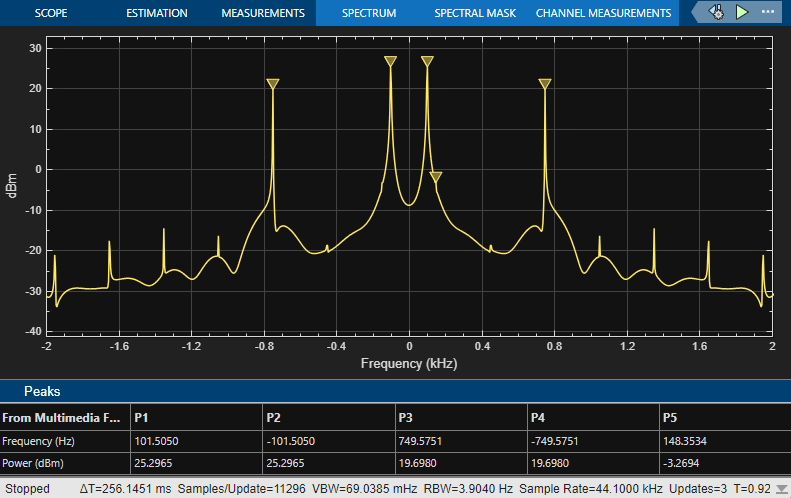
And the frequency domain looks like
Discussion
Use the peak finder, the top 2 positive frequency are
| Peak Number | Frequency () | Magnitude () |
|---|---|---|
| 1 | ||
| 2 |
So, the two basic types of signals were summed to create this mystery signal are
- Sine Wave
- Sine Wave
3. Prove the Concept of Fourier Synthesis by Reconstructing the Mystery Signal in the Time Domain
Description
After find out the top 2 basic type of wave inside the mystery signal. We are going to reconstruct it and see if that matches the original work. We may use more than top 2 signal to get a better fitting.
Analysis
A signal composed of two sine waves with frequencies of and can be mathematically expressed as follows:
- : Represents time in seconds.
- : The sine function, which generates the oscillating waveform.
- : Converts the frequency from Hertz (cycles per second) to radians per second, which is necessary for the sine function argument.
a more general form can be written as
Where
- and are the amplitudes of the sine waves.
- and are the frequencies.
- and are the phase shifts.
Assuming both sine waves have an amplitude of 1 and no phase shift, the expression simplifies to:
Simulation & Discussion
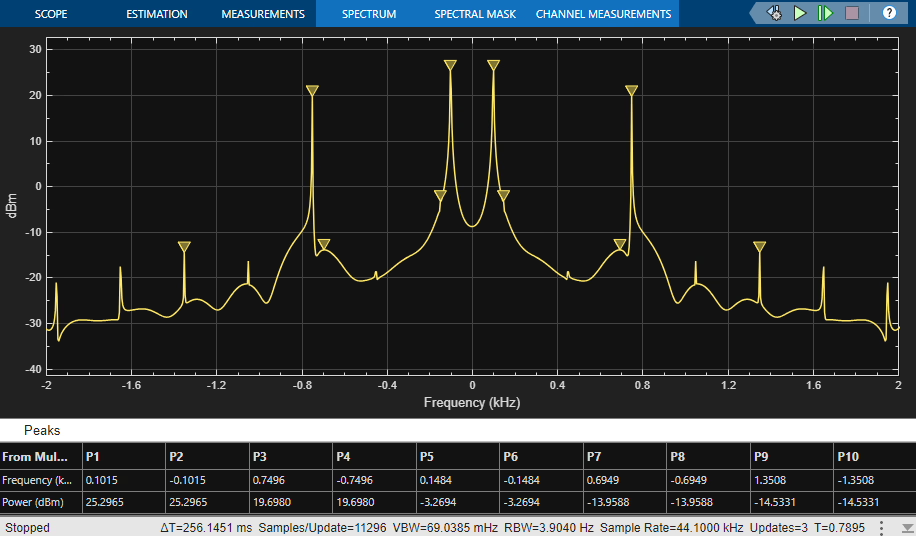
Use the peak finder, the top 5 positive frequency are
| Peak Number | Frequency () | Magnitude () |
|---|---|---|
| 1 | ||
| 2 | ||
| 3 | ||
| 4 | ||
| 5 |
Then, build a layout with 5 basic wave instead of 2 for better result
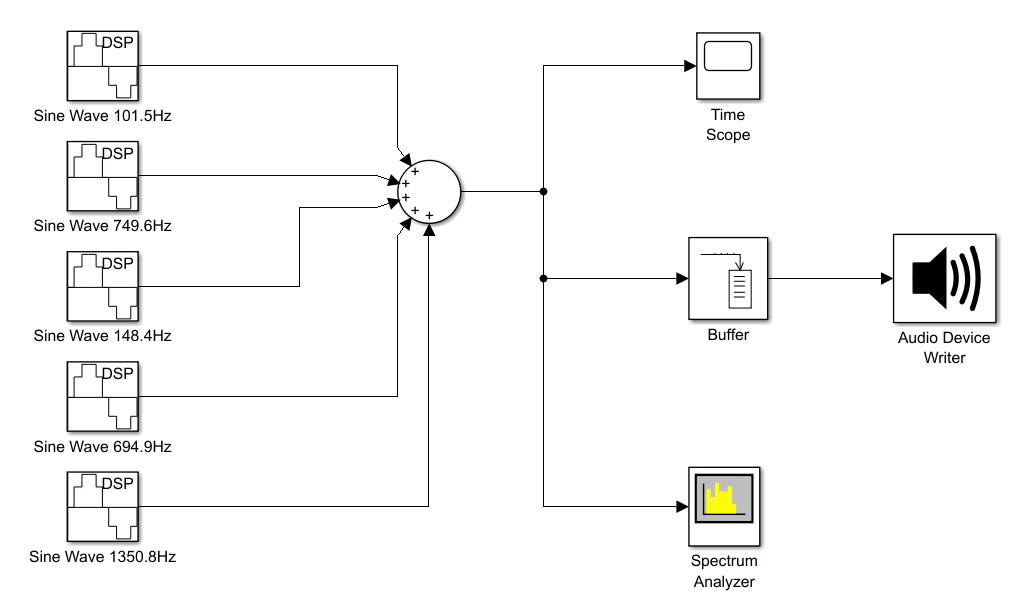
Let’s check the result
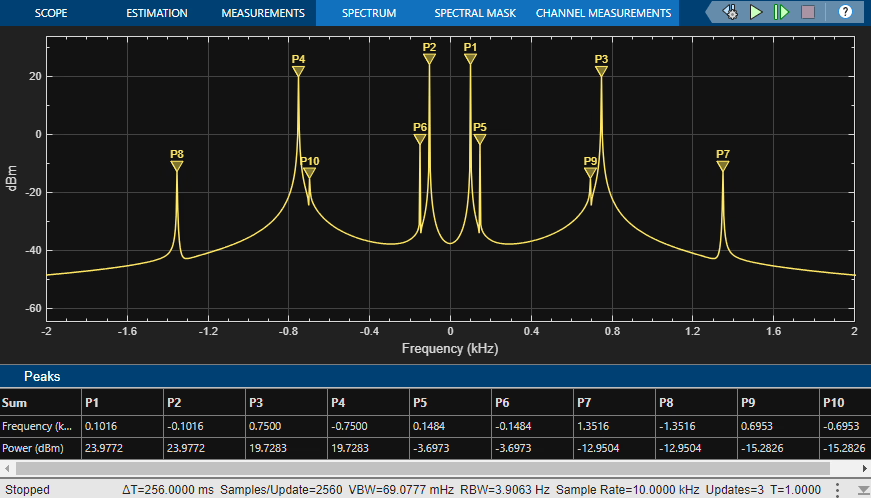
The power is not exactly matched, since they were adjusted by hand. But they are close, and get a result reconstructing signal of time domain like
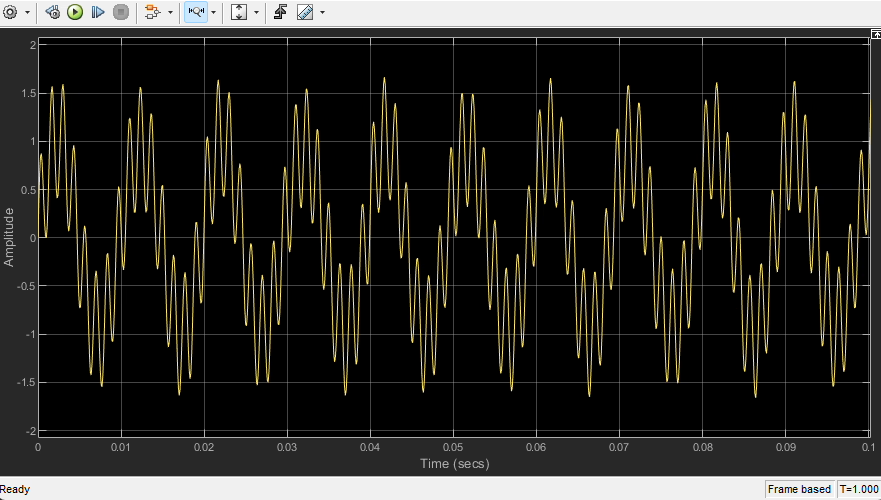
Compare our reconstructing signal to the original signal, they share the same period and shape.

The different in detail may due to leak of more basic type of waves and different power of basic type of waves.
4. Prove the Concept of an Analog High-Pass Filter Using an Inductor and a Resistor and Could I Make a Low-Pass Filter Using the Same Components?
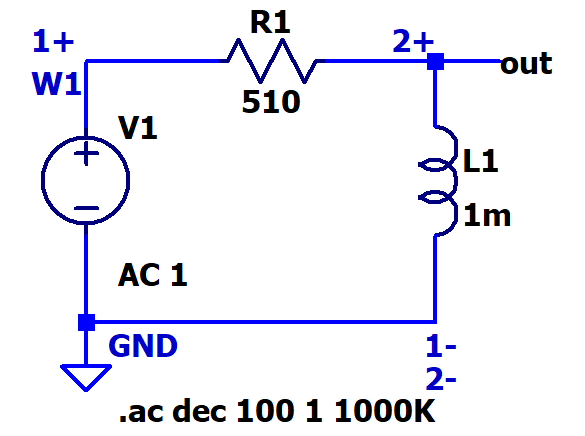
Circuit Schematic
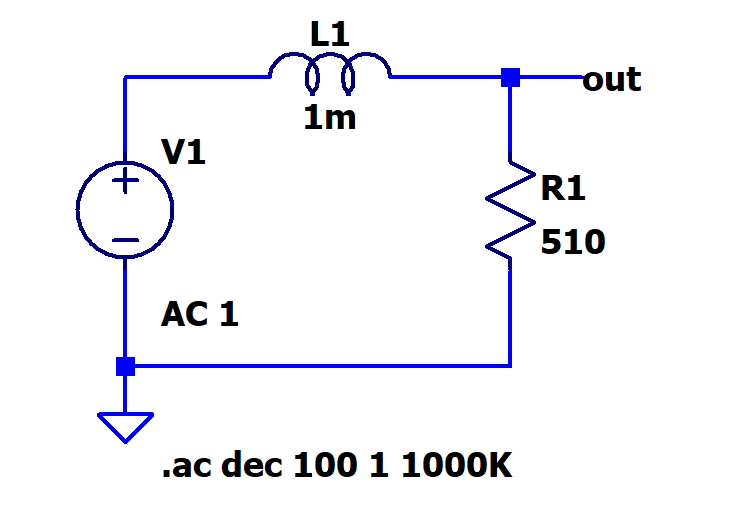
For low-pass filter
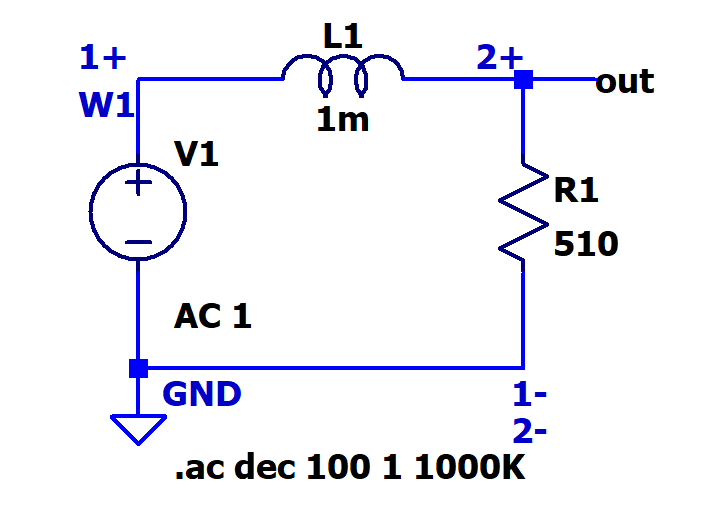
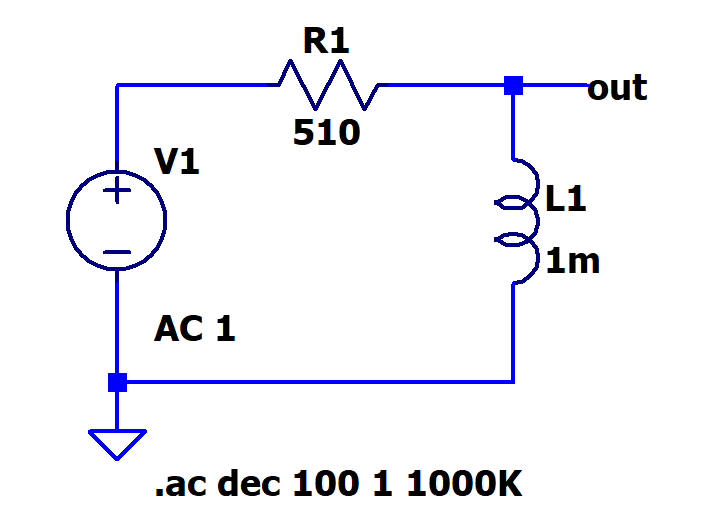
For high-pass filter
Description
We will make HF and LF filter using an inductor and a resistor. And check the result of frequency respond using network analyzer function in Analog Discovery 3.
Analysis
The cutoff frequencies for both the LR Low-Pass and LR High-Pass filters using component values
- Resistor ():
- Inductor ():
The cutoff frequency for both filters is given by:
Plugging in the Values
Simulation
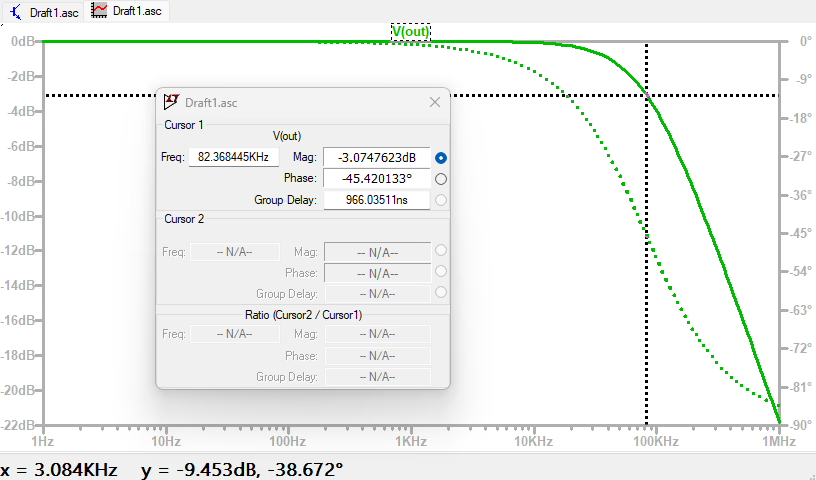
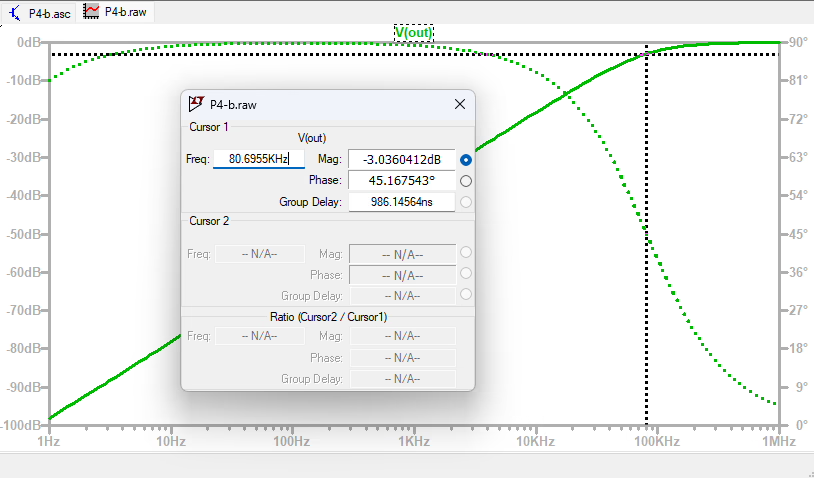
For low-pass filter
We got a cut off frequency around
For high-pass filter
We got a cut off frequency around
Measurement
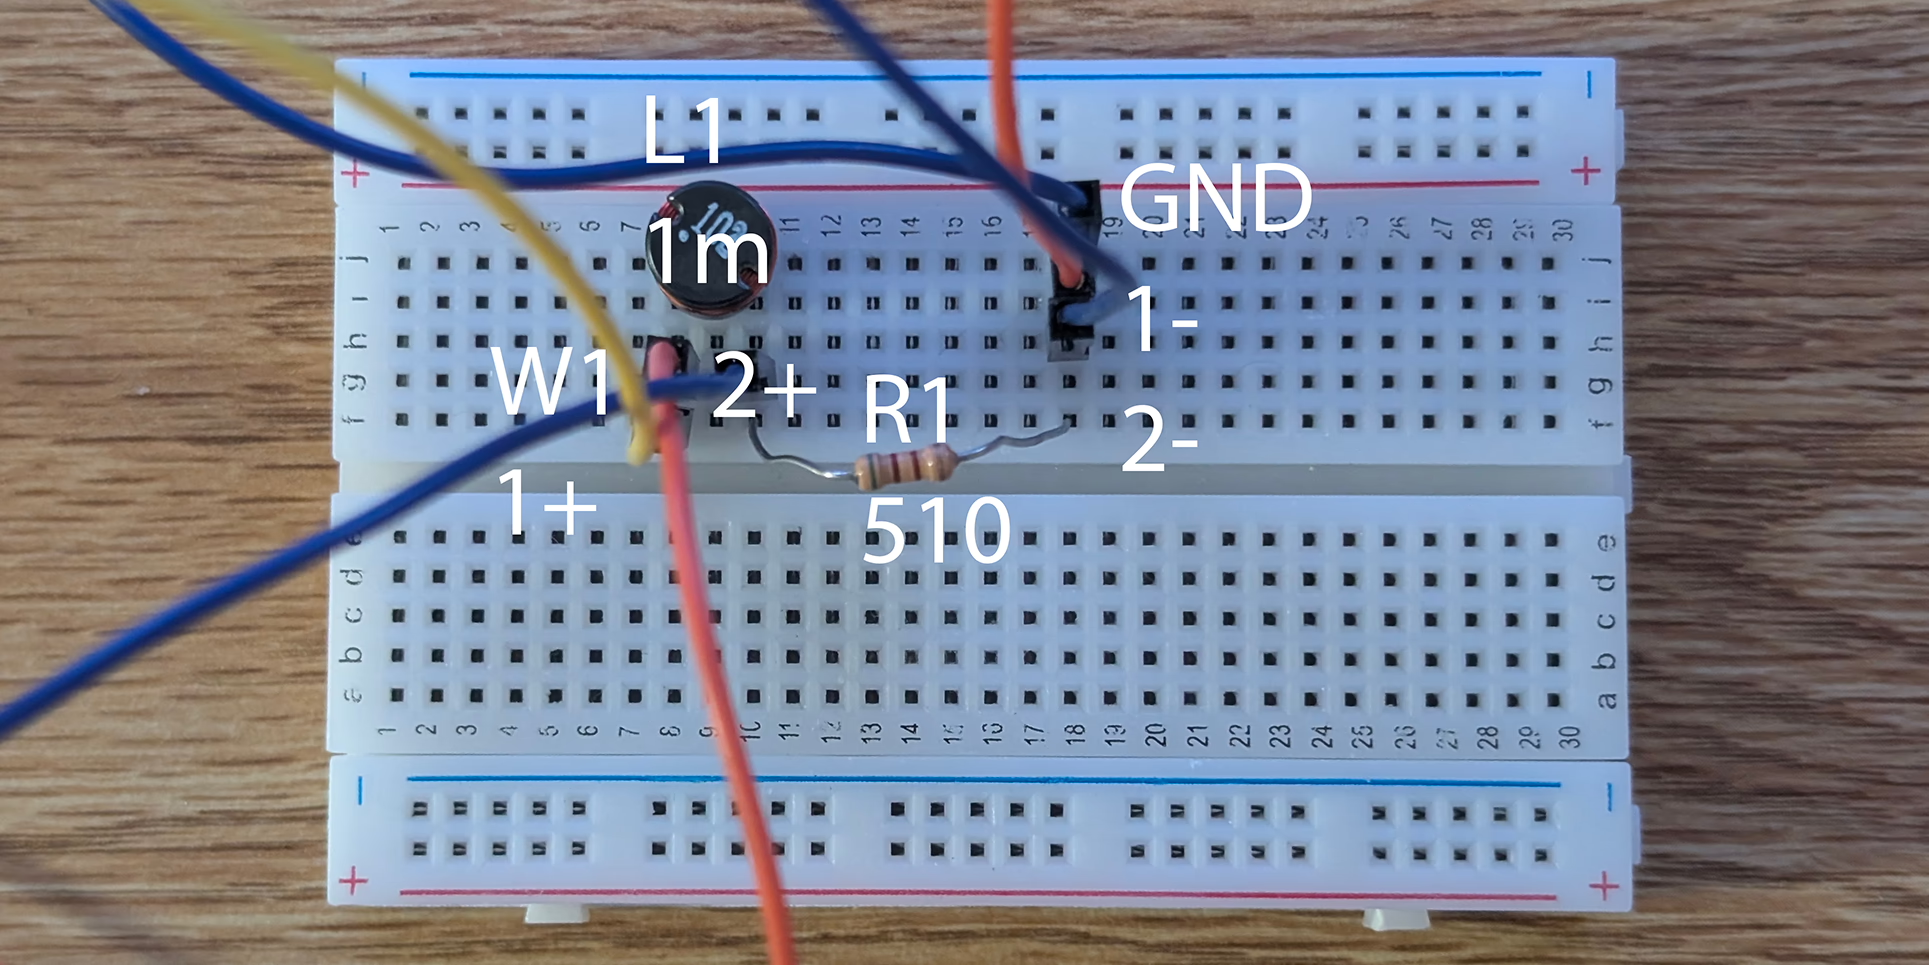
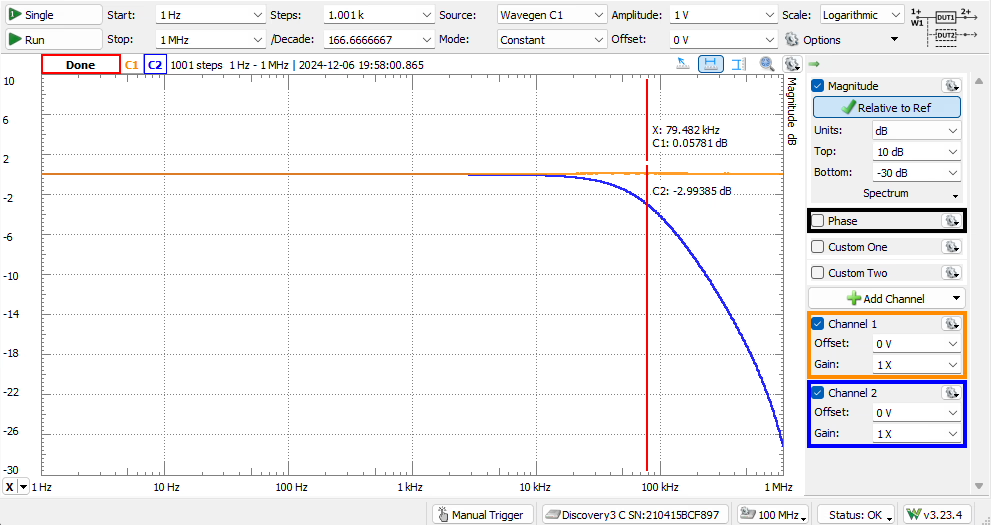
I am using the network analyzer to draw a frequency respond diagram. For low-pass filter, we had a setup like
We got a cut off frequency around
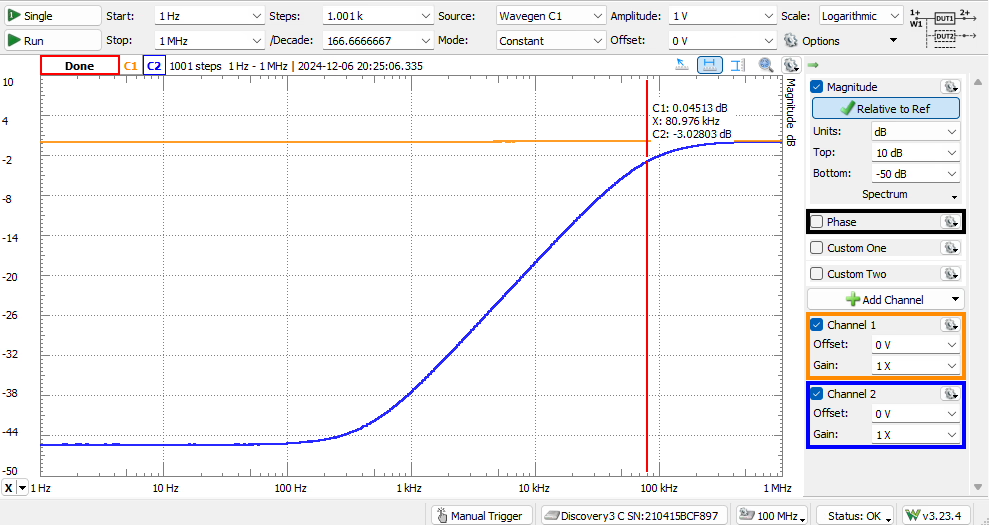
For high-pass filter

We got a cut off frequency around
Discussion
Our Simulation matches our Analysis. The Measurement also matches our Simulation and Analysis. Both of them has a cut off frequency around with mark of .
5. Prove the concept of using Fourier Analysis to associate audible features of an audio signal with specific frequency ranges in its frequency spectrum
Description
We are going to find out the leading signal of the given signal and try to reconstruct it. After reconstruction, we are going to compare some key feature to the original signal.
Analysis
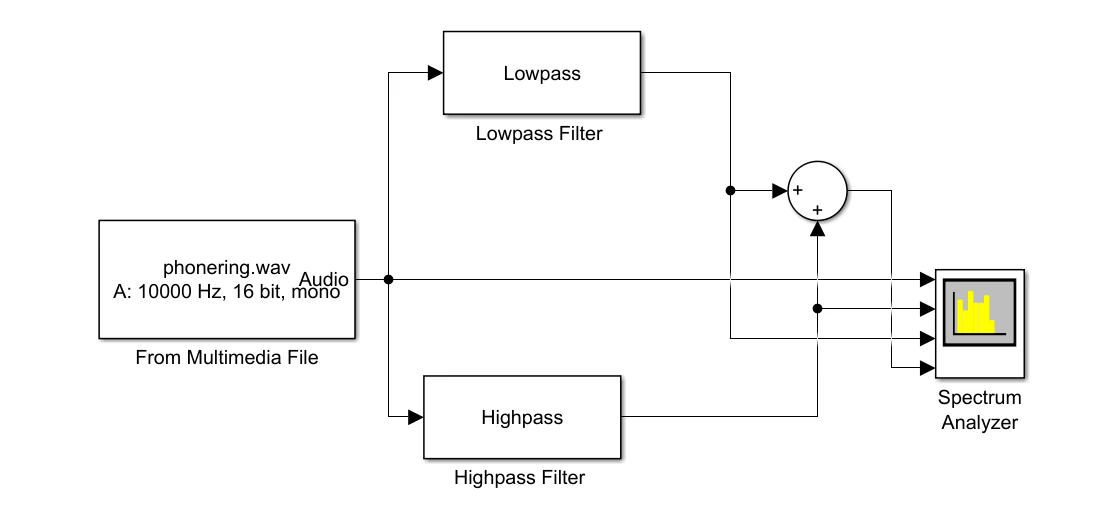
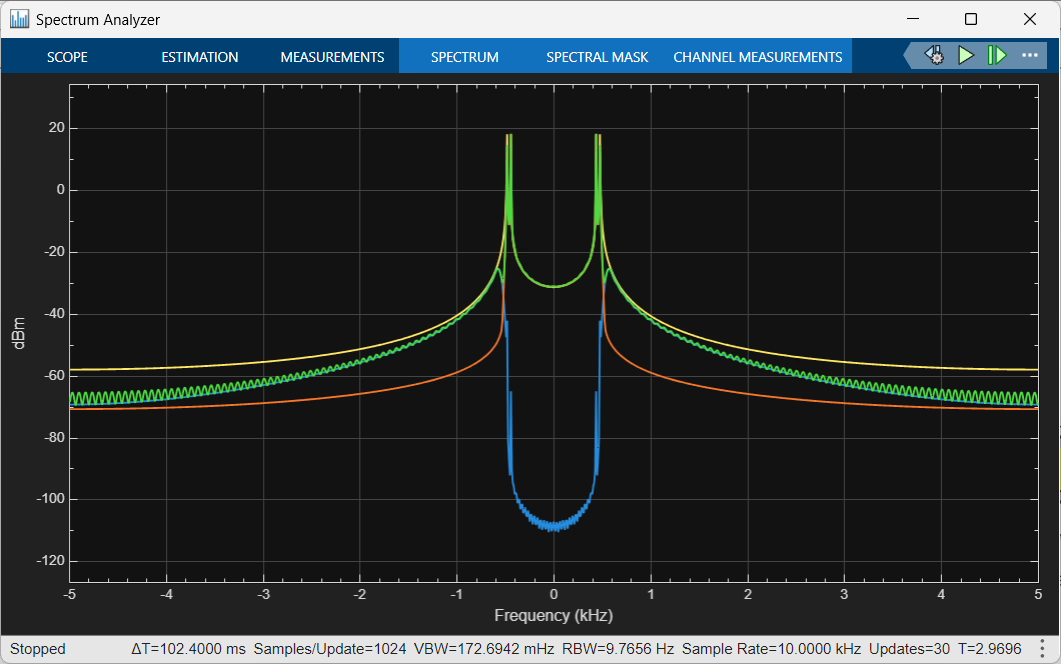
We used high-pass and low-pass filter to split two frequencies within a signal up. We ran these two frequencies, the original signal, and the two frequencies summed into the spectrum analyzer. We see the sum of the two filtered frequencies is fit to the original.
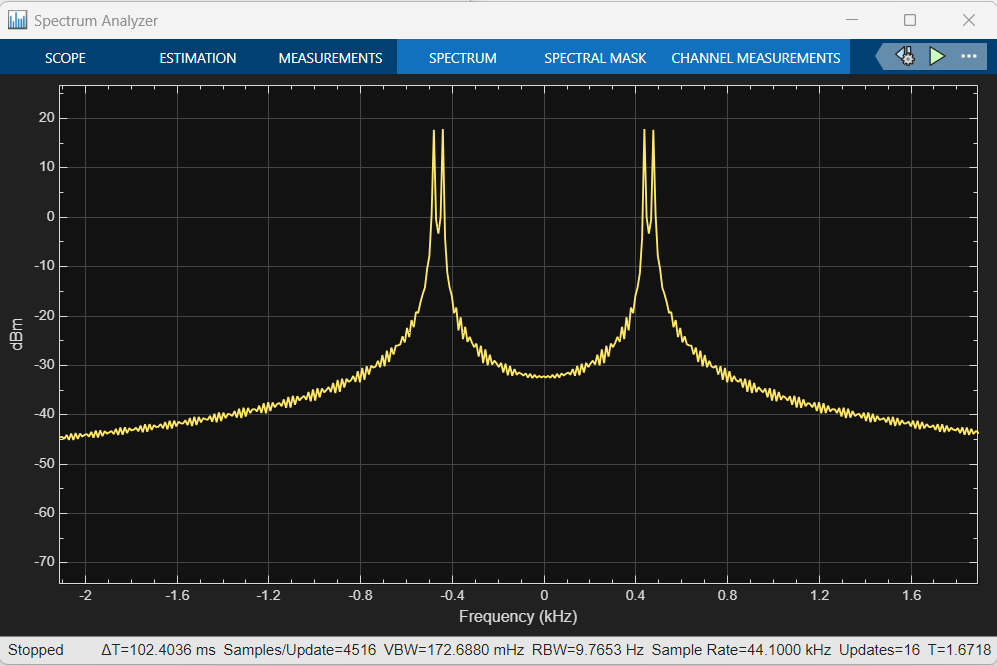
Then, we point out the main frequency from splay
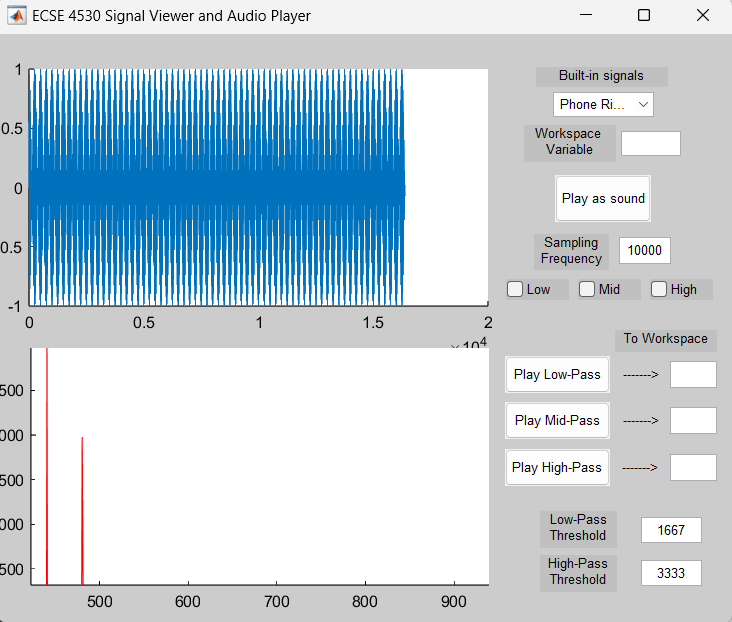
which are
Simulation & Discussion
Then, we reconstructed it.
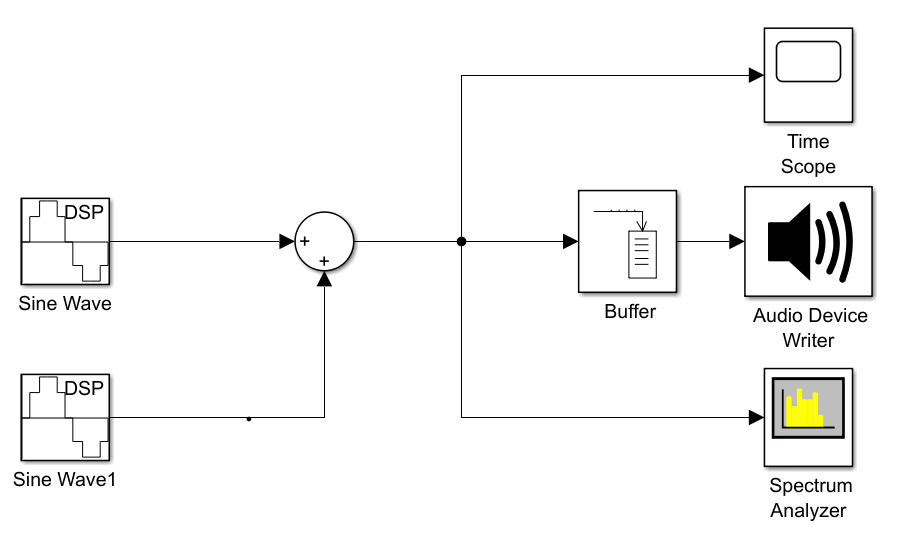
They have identical shape and frequency domain.

6. Prove the Concept of Filtering Out or Isolating a Particular Range of Frequencies of a Signal
Description
We are going to simulate the LP filter and using Simulink to create a mid-pass filter. After this, we are going to apply this to a song and see what can it change.
Analysis
We simulated a low-pass filter. Red is the raw signal, and the black is the filtered signal. As we can see, part of signal got removed.
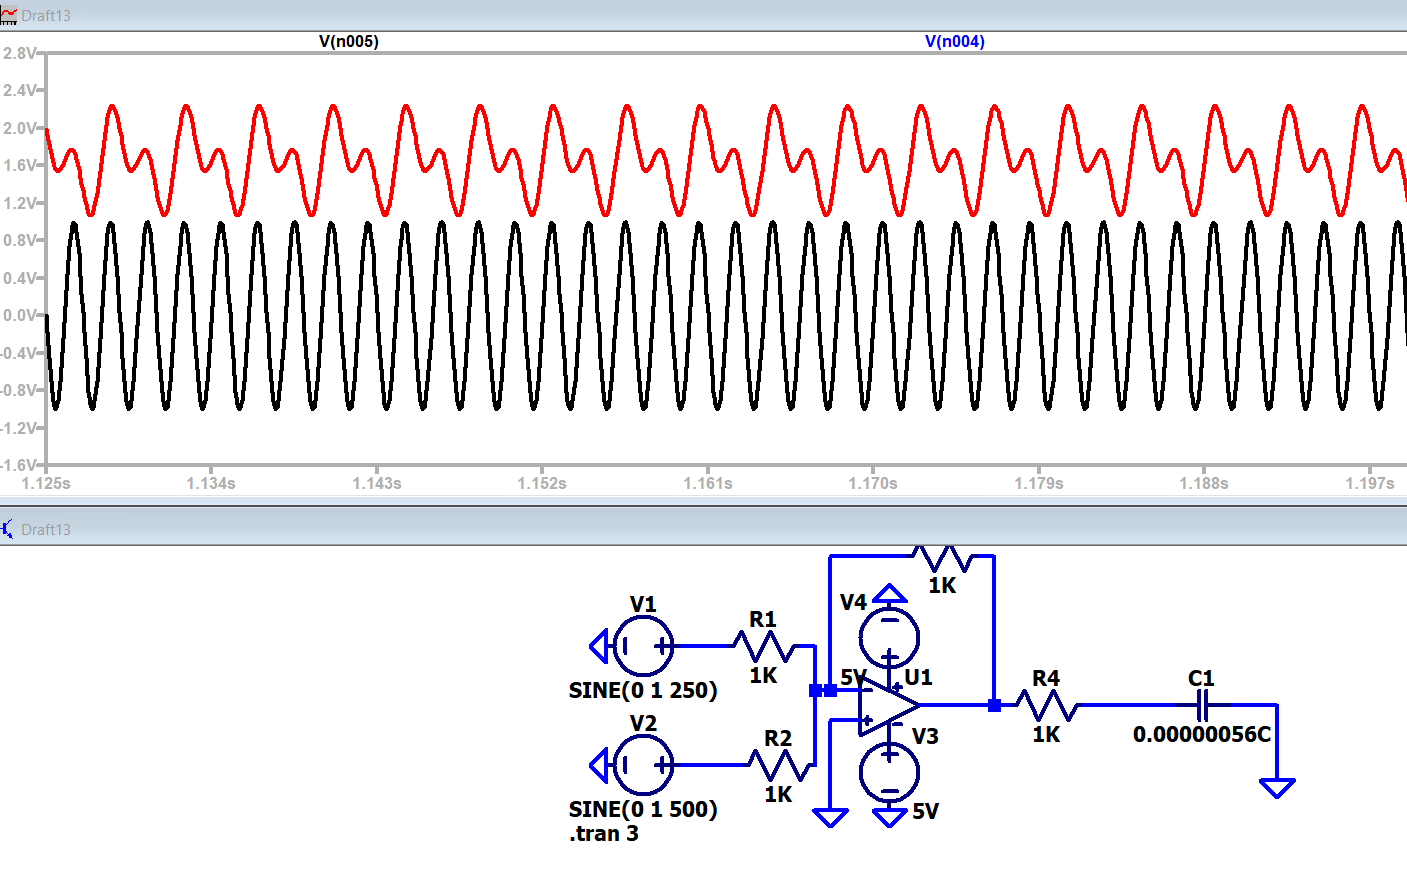
With the formula of
we can get the capacitance of the target LP filter.
Simulation & Discussion
Our audio file was that of Mary Had a Little Lamb. We wanted to hear a higher pitched version of it.
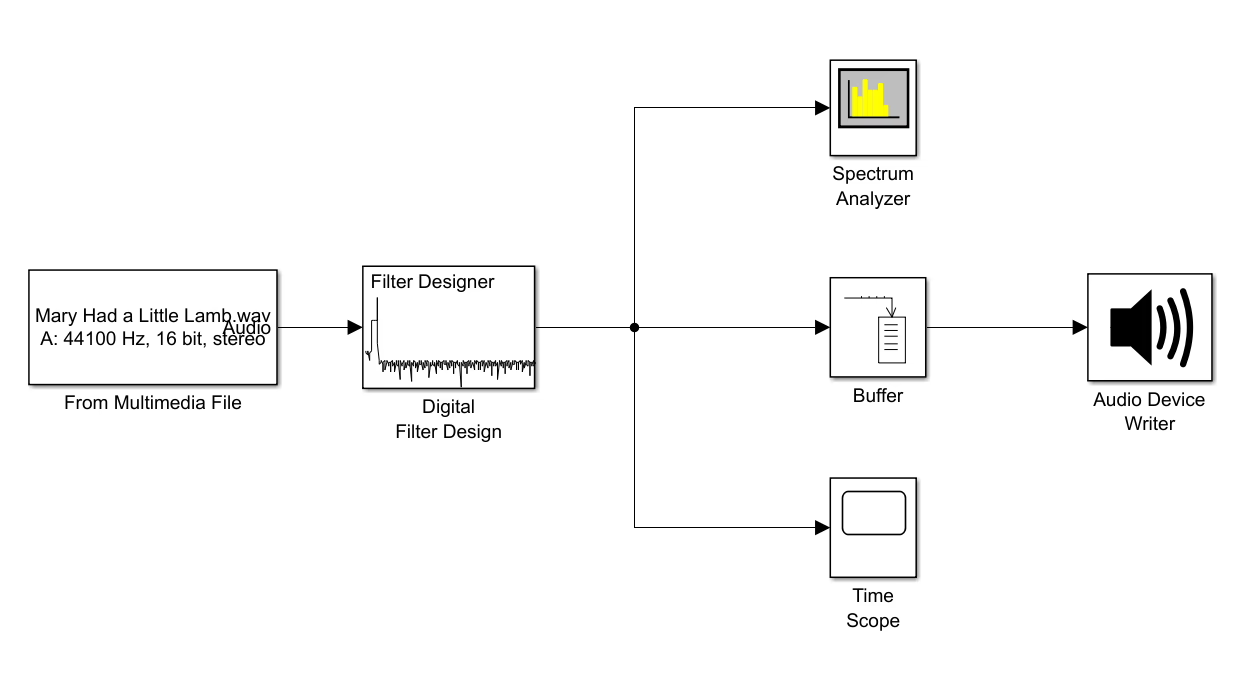
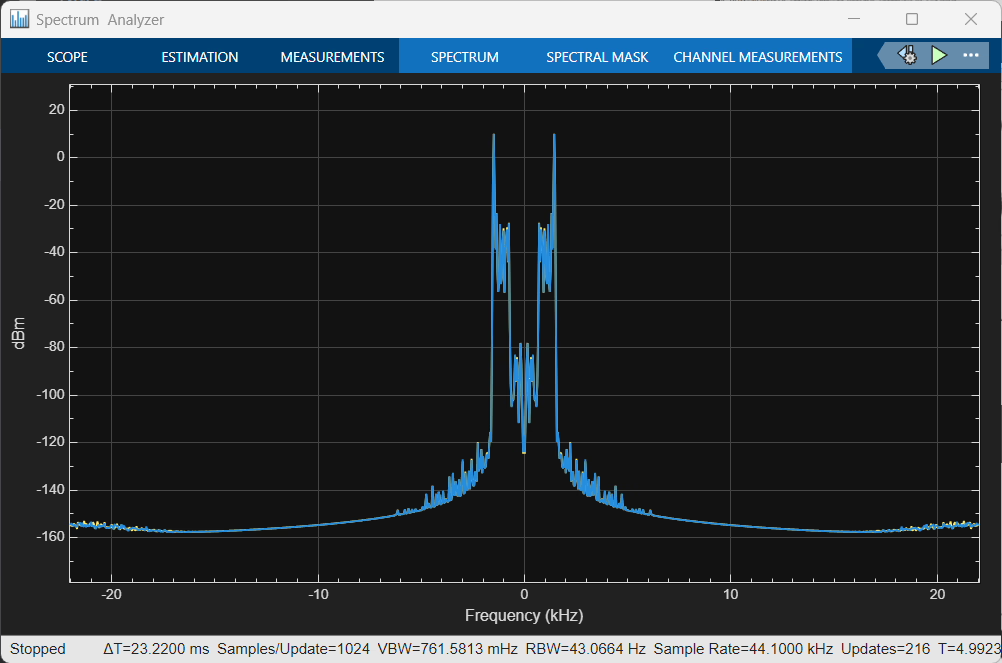
by applying a Mid-pass filter from to , we are able to remove part of the signal and able to hear about the sound. We isolate a specific, higher range of the song. We end up with a higher pitched version of the song and some high pitched screechy sound accompanying it. The higher pitched version is also less loud.
Related Content
- ECSE 1010 Proof of Concepts - Omega Lab01
- ECSE 1010 Proof of Concepts - Omega Lab02
- CSCI 1100 - Test Crib Sheets
- CSCI 1100 - Homework 8 - Bears, Berries, and Tourists Redux - Classes
- CSCI 1100 - Homework 7 - Dictionaries